Demographics and Socio-Economics
POPULATION AND DISTRIBUTION
In the 2015 Census of Population and Housing in the Philippines (PSA 2016), the population of San Lorenzo, Guimaras, was 26,112 people, with a density of 280 inhabitants per square kilometer. This is 2,080 more people or an increase of 8.66% from the 2010 population when 5,512 families were recorded in 5,214 households, at an average HH size of 5 persons. In 2015, the average HH size had decreased to only 4.2 persons. The most populous barangays are Cabano (4,917), Constancia (3,416) and M. Chavez (2,803) while Tamborong has the smallest population (1,133). Based on the 2015 census the coastal population of San Lorenzo consists of 14,554 people or 55.74% of the town’s population, and is 13.44% higher than the coastal population in 2010 (12,830 people).
POPULATION LEVELS AND GROWTH PATTERN
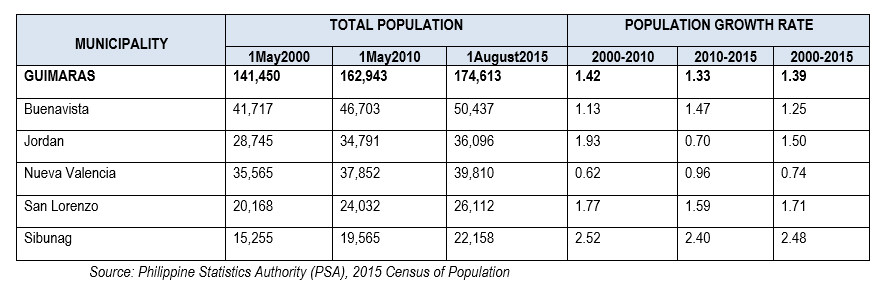
San Lorenzo has the second lowest population among the five municipalities in the Province of Guimaras with 26,112 or 15.0% share. Buenavista is the most populous with a population size of 50,437 or 28.9%, next is Nueva Valencia and Jordan with 39,810 or 22.8% and 36,096 or 20.7% share respectively. The least populated is the municipality of Sibunag with 22,158 or only 12.7% share. It was also the least populated municipality in 2010.
Table 5: Population and Annual Population Growth Rates by Province, City, and Municipality in Region VI – Western Visayas: 2000, 2010 and 2015
AVERAGE HOUSEHOLD SIZE WAS 4.4 PERSONS
In the Municipality of San Lorenzo, the number of households in 2015 was recorded 26,104, higher by 2,072 households compared with the 24,032 posted in 2010. The average household size (AHS) in 2015 was 4.4 persons, lower than the AHS of 4.6 persons in 2010.
Table 6: Total Population, Household Population, Number of Households, and Average Household Size by Province, City and Municipality as of August 1, 2015: Region VI – Western Visayas

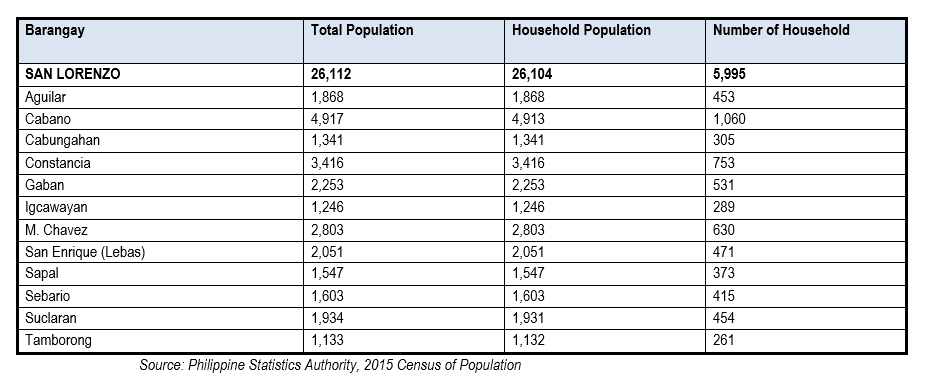
HIERARCHY OF BARANGAYS
San Lorenzo has a total population of 26, 112 out of the 174, 613 total population of the Province of Guimaras based on the August 1, 2015 Census of Population (POPCEN). Cabano has a population of 4,917 which is the most populated barangay in San Lorenzo followed by Constancia and M. Chavez with 3,416 and 2,803 respectively. The least populated barangay is Tamborong with 1,133.
POPULATION PROJECTION:
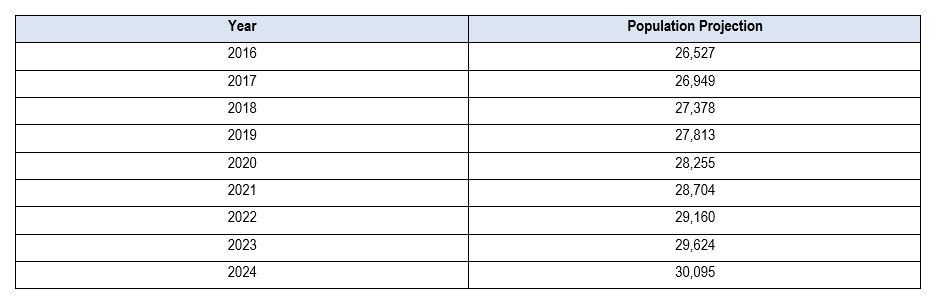
Base: 2015 population (PSA) – 26,112
Growth Rate – 2010-2015 – 1.59
26,112*1.59%= (415.18+26,112) = 26,527
SEX RATIO
Males accounted for 51.3 percent of the total population of Guimaras in 2015, while females comprised the remaining 48.7 percent. These figures resulted in a sex ratio of 106 males for every 100 females. The same sex ratio was recorded in 2010.
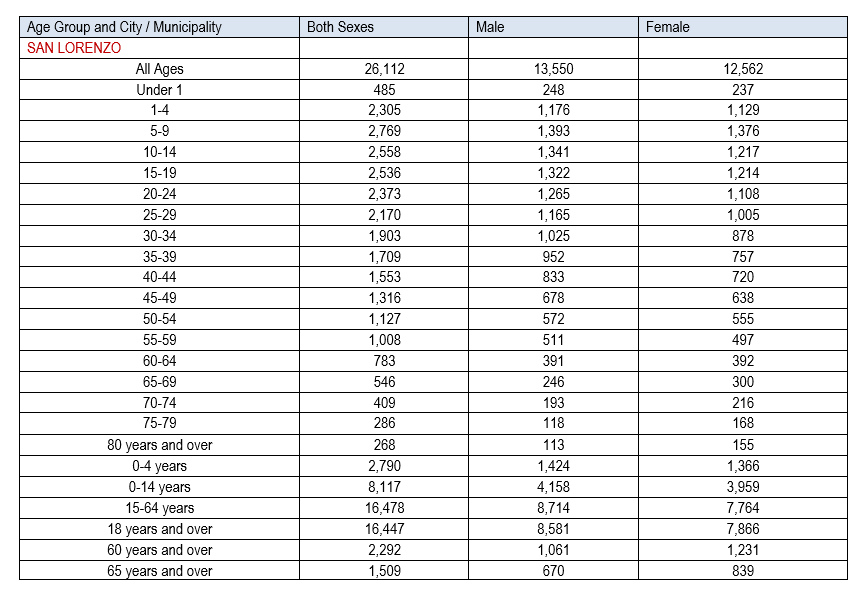
In the Municipality of San Lorenzo, 51.2% of its 2015 population were male while the remaining 48.8% were female.
Table 9: Household Population by Age Group, Sex and City/Municipality: 2015
LITERACY RATE WAS RECORDED AT 99 PERCENT
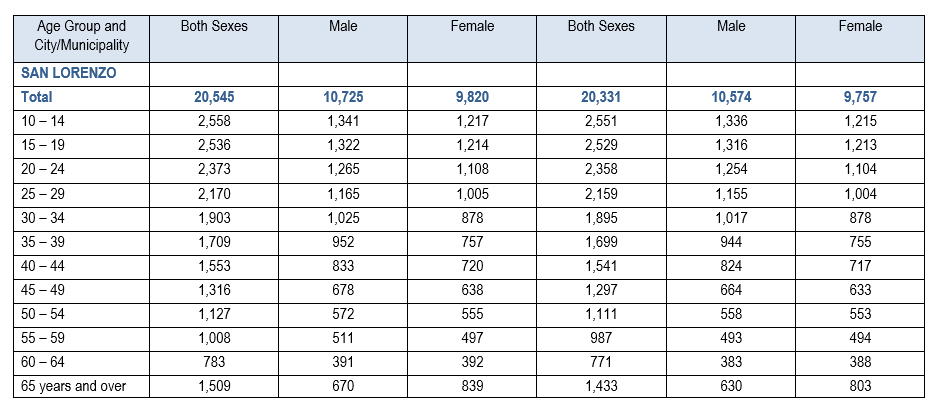
The Municipality of San Lorenzo posted a literacy rate of 99 percent among the 20,545 household population aged 10 years and over. Literacy rate in 2015 was high among males which is 51.5 percent than female which is 47.5 percent.
Table 10: Literacy of the Household Population 10 Years Old and Over by Age Group, Sex, and the City/Municipality: 2015
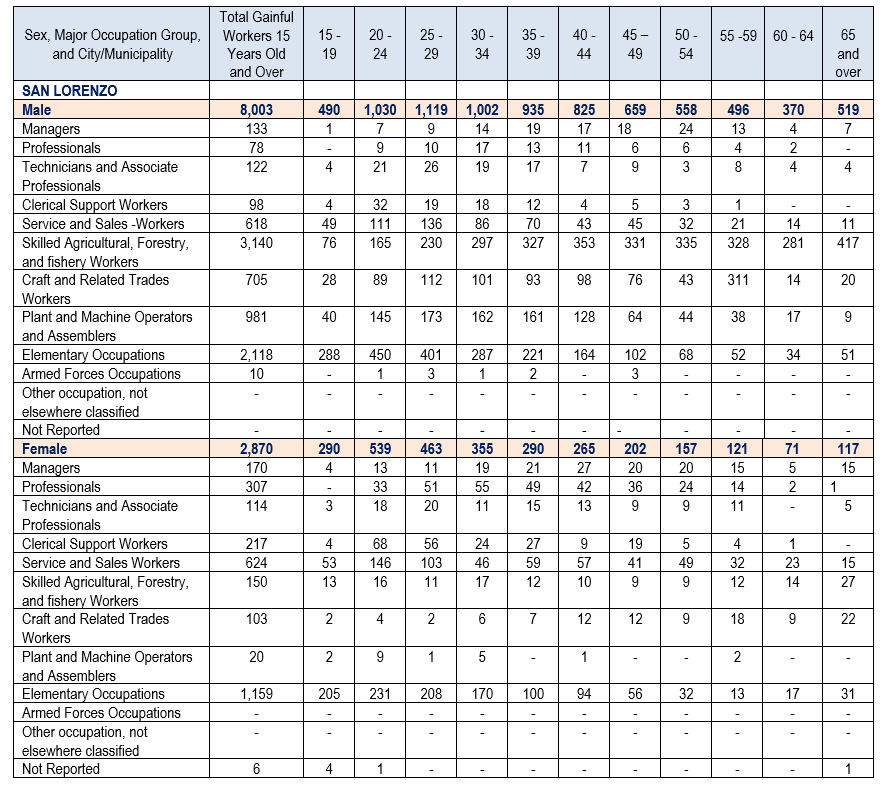
Three in every five persons aged 15 years and over were engaged in a gainful activity
In 2015, the Municipality of San Lorenzo had 17,987 household population aged 15 years and over. Of this total, 60.4 were engaged in a gainful activity during the 12 months preceding the census. Males with a gainful activity during the last 12-month reference period comprised 73.6 percent, while females accounted for the remaining 26.4 percent.
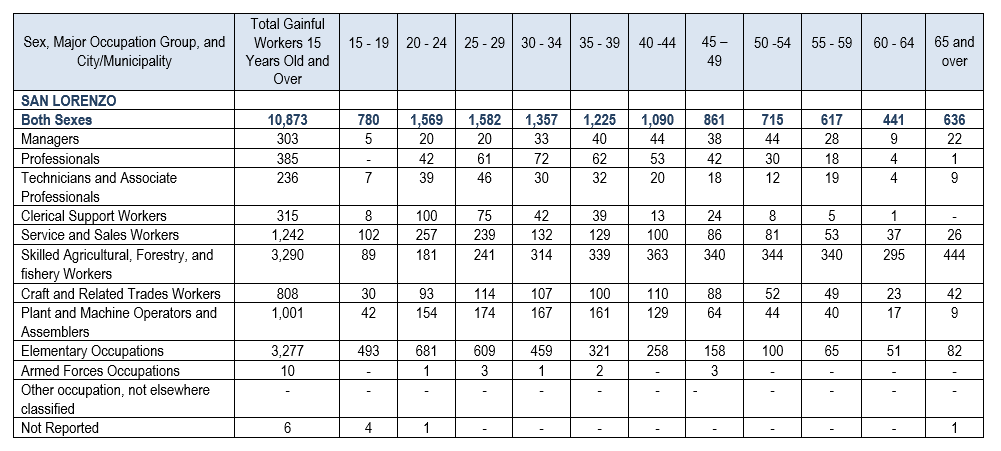
By major occupation group, workers engaged in skilled agricultural, forestry, and fishery workers comprised the largest group (30.25 percent of all persons with a gainful activity). Elementary occupation came in next (30.13 percent), followed by service and sales workers (11.42 percent).
Table 11: Gainful Workers 15 Years Old and Over by Major Occupation Group, Age Group, Sex, and City/Municipality: 2015
MALE AND FEMALE